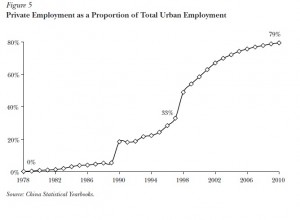
In Chinese cities, roughly 1 in 5 workers is employed by the government, or so it is thought.
In the US, there are about 4.5 million federal employees, about 4.3 million state employees and 12 million local employees, for a total of 20 million people working directly for the government. There are a total of 144 million people employed, which means that 14% of our employees work directly for government. I would venture a guess that twice this number work indirectly for it. I am not in the mood for commentary today. That’s just a cr@pload of people – you go where you wish with that fact.

Well, I will go first.
Of note, is that the graph begins in 1978 and not whenever Mao did his heroic long march, which would have extended the flatline and made the graph more dramatic.
My first thought was to disbelieve any graph that depicts what is going on in China. My next thought was that this baseless line must haven given birth to say something about how much the Chinese have liberalized themselves since Jang Jing had her hissy fit and burnt books and ordered more purges beyond the millions her sweet hubby had done. Yes, China is moving to a mixed economy.
But maybe I over-read the graph, hoping it will make any point.
In 1978, Jimmy Carter started the Department of Energy, and this led to China’s present government employee levels, and since the seas have risen just x centimeters, we are on the right track, government employee wise.