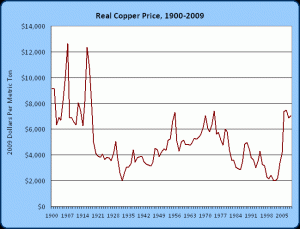
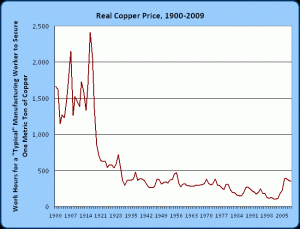
Look at what has happened to the scarcity of copper over the past 100 years.
The top chart adjusts nominal copper prices to account for the general rise in prices since 1900 using a measure of the CPI’s broad inflation index. The bottom chart takes a different approach to adjust the copper data. It looks at the hourly wage of a typical manufacturing worker and asks how many hours would a typical worker need to work in order to secure a unit of copper.
More on these ideas in a future post, as well as data on annual copper consumption and “known” reserves. I am also assembling longer term data series back at least another 100 years, and possibly much, much, much farther back. I am also leaving out any discussions of inflationary pressures, the role of commodities during those episodes and when/whether prices reflect true scarcity value – these are issues that deserve much longer and more careful discussion.
(note, I imputed the hourly wages for 1915-1918). Copper data from USGS, CPI data from BLS and wage data from Historical Statistics of the United States and BLS.
By any metric, the scarcity of copper is no higher today (in fact, it is much lower) than it was over 100 years ago, even as human consumption of copper has rocketed with economic growth and population growth. In real terms, copper prices have fallen by 23% since 1900 from $9,172 per metric ton to $7,043 per metric ton today. In 1900, it took a typical manufacturing worker 1,665 work hours to secure himself a ton of copper. Today, a similar worker would only have to work 353 hours to get it – a decrease of over 75 percent over the course of the century. And as I will show you, these are lower bounds for just how scarce copper really has become. Copper prices would have to rise to $33,250 per metric ton to make it just as hard for a typical worker to get it today as it was in 1900. Alternately, if copper prices remain unchanged, the typical worker would have his pay slashed to just over $4 per hour in order to be in a position that his 1900 counterpart was in.
But this is just copper, right?


I wish the scales on your graphs were more legible, Wintercow. (No, I do not have a CRT monitor.)
The graph tracks the world economy and how it was affected by the development of earth-moving equipment, efficiency in shipping, the demand generated by telephone wire, electric motor wire, and the business cycle.
Check that: If these are BLS numbers, do they measure the US domestic price?
One puzzling aspect is the rise from 2004 to the present, undoubtedly affected by supply (revolution? “fair trade” tariffs?), demand (why the big jump in demand? Copper roofs? I know everybody was stealing copper pipe and copper gutters the past five years), and the value of our currency. It goes all the way from $2000 per ton to above $7600 per ton.
I’m glad I never tried to make a living trading copper futures for my own account. Much of the graph tracks the stock prices of the air transport industry, only copper, unlike air transport, has temporarily halted its descent. In dollar terms, that is. Maybe using the CPI to discount the value of the dollar explains this.
harry, click the charts and they will expand. That the commodities markets have become the realm of people seeking shelter from inflation makes the price a less than reliable signal of scarcity, which I will write much about in the future. These are historical average spot prices, derived from USGS and other sources but you can generally consider them the world price for the resource.