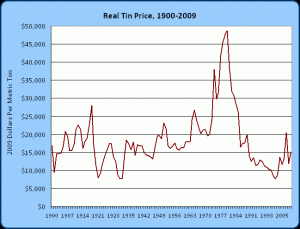
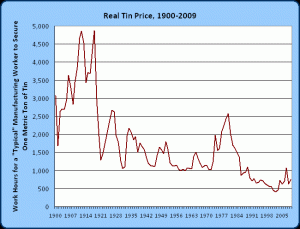
Look at what has happened to the scarcity of tin over the past 100 years.
The top chart adjusts nominal tin prices to account for the general rise in prices since 1900 using a measure of the CPI’s broad inflation index. The bottom chart takes a different approach to adjust the tin data. It looks at the hourly wage of a typical manufacturing worker and asks how many hours would a typical worker need to work in order to secure a unit of tin.
(note, I imputed the hourly wages for 1915-1918). Tin data from USGS, CPI data from BLS and wage data from Historical Statistics of the United States and BLS.
By any metric, the scarcity of tin is no higher today (in fact, it is much lower) than it was over 100 years ago, even as human consumption of tin has rocketed with economic growth and population growth. In real terms, tin prices have fallen by 11% since 1900 from $16,930 per metric ton to $15,051 per metric ton today. In 1900, it took a typical manufacturing worker 3,074 work hours to secure himself a ton of tin. Today, a similar worker would only have to work 754 hours to get it – a decrease of over 75 percent over the course of the century. And as I will show you, these are lower bounds for just how scarce tin really has become. Tin prices would have to rise to $61,382 per metric ton to make it just as hard for a typical worker to get it today as it was in 1900. Alternately, if tin prices remain unchanged, the typical worker would have his pay slashed to just over $4.90 per hour in order to be in a position that his 1900 counterpart was in.
But this is just tin, right?

