WINTERCOW in 2010: Sorry to be reposting. But again I think the message is worth repeating, especially on this wonderful day. I don’t want you to feel down about it at all. If you would like to see the data from the remaining eleven days, start here.
As children around the world open presents on this Christmas Day, some “E”nvironmentalists shudder in horror at the massive wasting of resources that such a “consumption orgy” entails. Hundreds of thousands of trees cut down just to make wrapping paper and boxes; millions of barrels of oil and other energy consumed in order to produce and ship all of those presents; millions of tons of copper, tin, aluminum, gold, and other valuable minerals extracted and used up; and so on … And all for what? To add a little unnecessary fa-la-la to people’s already decked the halls lives?
Over the next 12 days I will be showing you a glimpse of the wonders produced by the human mind and spirit. Each of these is merely scratching the surface of coming up with an operational and appropriate measure of scarcity at any given moment, but taken as a whole (and this is part of a much larger project) they would give you a much better sense for whether “we are running out of resources,” or whether we are “unsustainably trashing the planet,” as many seem to think is the case.
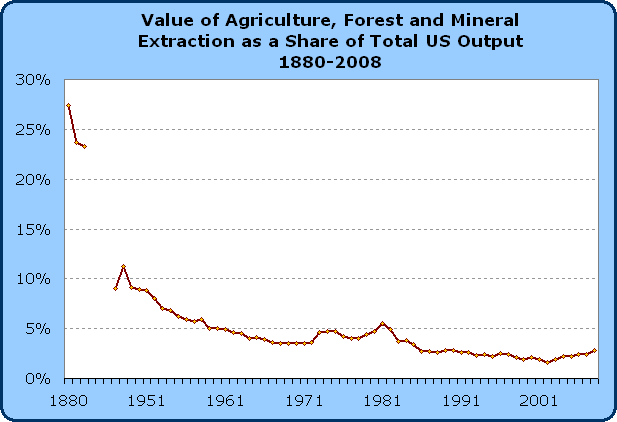
The chart below shows data points for 1880, 1890, 1900 and continuously for 1948 through 2008 the share of U.S. Gross Domestic Product that is coming from what you might consider “extractive” industries. These include agricultural activities, hunting activity, fishing activity and all mineral extractions (including coal, oil, gas and uranium) in the U.S.
In order to determine how “scarce” our natural resources are becoming, it requires a more serious analysis than simply looking at the amount of physical resources consumed and extracted over time. Such an exercise would demonstrate that our natural resource production and consumption has risen consistently year after year after year, for virtually all time. One way to analyze how scarce natural resources are becoming is to look at how much of our total income is dedicated to obtaining natural resources. The chart below approximates this amount.

Sources: Bureau of Economic Analysis, Survey of Current Business, Historical Statistics of the United States. Pre-1948 data excludes forestry, fishing and hunting
In 1880, “we” spend nearly a third of our income to obtain the natural resources that are important inputs to our production and living processes. I’ve seen and read estimates that just after the Civil War, the share was closer to 50%. So, we spend a third of our income to secure the natural resources … just so that we could use them to produce living standards that left the average American dead before the age of 40, with an average income 1/8 of what ours is today, and with virtually none of the safety and comfort we enjoy today.
Fast forward to our present time, where “we” use less than three percent of our income to secure the important natural resources to “run” our lives (this is slightly up from a trough of 1.6% in 2002 – notice the peaks during inflationary periods). Our expenditures on natural resources have fallen substantially (by this metric) even as our living standards continue to escalate – with the average American living near 80 and where we are more worried about obesity and sloth than we are about malnutrition and grinding work days.
I’d remind you that this data includes energy extraction. If I were to show you the data on minerals alone (excluding energy and agriculture … that chart may be coming at the end of this series), you would find that the value of mineral resources alone accounts for substantially less than one percent of the value of our GDP.
What are the implications of these trends? First is that natural resource scarcity poses no significant threat to our modern standard of living. Even if the cost of minerals were to double, triple, or even quadruple, it would still make up a miniscule portion of our budget. Even if all extractive resources doubled or tripled in scarcity value, they would still make up less than 10% of our budget. And absent political interference (which is here to stay alas) there is no reason to believe that the trends of the last thousand years in natural resource scarcity should turn around at this point.
Merry Christmas to the Herd!