I was recently asked to put in perspective what will happen to Americans from the large recent increases in world wheat prices. Below are some partial thoughts. Most of the following national data comes from a government report called the Consumer Expenditure Survey (CEX). Before presenting some basic statistics on household food consumption, it is useful to remember that since 1900, US incomes and expenditures (nominal) have increased over 50-fold.
The availability and quality of all consumer goods items (housing, education, health care, entertainment, clothing, transportation, communication, etc.) has exploded over the last century, and continues to this date. When consumers were spending a larger portion of their budget on food in earlier years, they had far fewer choices and the quality is not what it is today – which makes the decrease in the budgets allocated to food today even more remarkable than the figures indicate.
It is important to remember that individuals in different income classes spend far different proportions of their budgets on the different items, in particular food. Wealthier households dedicate a far smaller portion of their income to food than lower income families. While the data I will show you reference the “average American household”, the trends are true throughout the distribution of income.
- In 1901, when the average American spent $770 per year, (none of these figures are adjusted for inflation), 42.5% was allocated for food ($327). For comparison, if a worker today earning $50,000 allocated that much for food, he would be spending $21,250 for food per year.
- In 1918-19, when the average American spent $1,434 per year, it spent $549 for food, or 38.2% of total expenditures.
- In 1934-36, when the average American spent $1,512, it spent 33.6% on food, still the largest budget item for the average household.
- In 1950, when the average American family spent $3,808, it spent 29.7 percent on food, still the largest allottment
- In 1960-1, when the average American family spent $5,390, it spent 24.3% of its budget on food, now in second place to housing.
- In 1972-3, when the average American family spent $8,348, it spent 19.3% on food ($1,596).
- In 1984-5, when the average American family spent $21,975, it spent 15.0% in food
- In 1996-7, when the average American family spent $34,312, it spent 13.8% on food.
- In 2006, when the average American family spent $48,398, it spent 12.6% ($6,111) on food
Here is the same information in tabular format for simplicity:
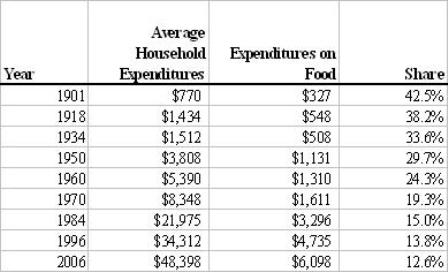
“Food” includes all food consumed at home plus away from home. Note that in agrarian subsistence societies (such as the Western Frontier in the 19th century) even larger proportions of “income” were devoted to food – because virtually all production in the home was dedicated to producing food to survive.
But even the presentation I have given you slightly distorts things. What matters is not the price of flour, nor how much of one’s income is dedicated to it, but rather how many hours a typical person would have to work to secure a 5 pound bag of flour. I present some data below showing how many hours the typical worker needed to work in order to earn enough to purchase a simple 5 pound bag of flour. I picked transportation workers, but the same trend is evident for any other type of worker.
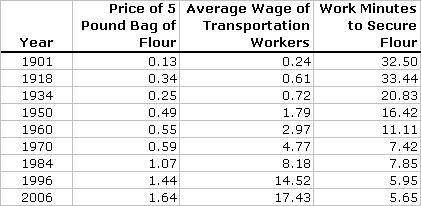
The remarkable thing about this is that if you look back to the middle-ages, it probably took well over 200 man-hours for someone to produce a 5-lb bag of flour for themselves. Now it takes about 5 minutes.
What we are missing is how much of the typical food budget is spent on flour and flour related products. As you mentioned to me, a bagel is something like 25% flour. If that is the case, given the variety of food we eat, I can’t imagine the share of flour exceeds 10%. So even if flour prices doubled and all of those price increases were somehow passed onto us (unlikely), then the typical American’s food bill would increase by $610 (2006 is latest data I have). That $610 represents just 1.26% of the typical family’s budget in 2006. Look back to 1901. Even making the unlikely assumption that flour makes up 10% of their diet (it was likely more for reasons I stated above), a doubling in flour prices would result in a food bill increase of $64. But this $64 represents 8.3% of the budget of Americans at that time. To compare, modern Americans spend LESS than 7% of their budgets on health care today.
A final point, for now, is that consumers are much more able to adjust to increases in wheat prices today than they were in the past. The globalization of trade improves the ability to secure imported wheat, or to rely on other staples. For a future post, why have wheat prices increased so rapidly and so dramatically in the past 12 months?
Would it have anything to do with the housing bust and the subprime fallout? Given that a lot of commodity prices have increased or remained strong, would it be safe to say that investors are switching to commodities such as gold, oil, wheat, etc? Has this, in turn, had an affect on inflation?
We are certainly seeing increased speculative interest in the commodity sector (though this is a net positive!), but that alone explains a small fraction of the meteoric rise in commodity prices since roughly 2004-ish. Speculators follow trends, they don’t set the agenda. It might sound hackneyed, but it all goes back to simple supply and demand. Commodity investment is highly cyclical – it takes time to increase supply, and simply put, supply growth in oil and gold and food hasn’t kept up with demand growth (you can blame market distortions for part of this – oil price controls in China, shifty tax regimes in Canada, corporate corn welfare in the US, etc) . But the price-signaling function of futures markets is working, just look at the latest USDA crop report…