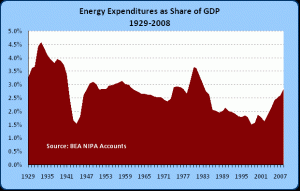
We are spending more of our income on energy today than ever before, right?
Wrong!
Even allowing for the inflation / commodities boom preceding this recession, energy expenditures make up about 2.7% of GDP. I plotted data back to 1929. Our energy expenditures peaked, as a share of GDP, in the depths of the Depression (ask yourselves why) at just over 4.5% of income and there has been a secular decline since. This is all happening at a time when energy is increasingly important in our economic lives (ask what portion of your daily activities would be possible without produced energy and compare that to how your answer would change in, say, 1800).
Despite massive government intervention in, and distortion of, energy markets, energy makes up a much smaller share of our budgets than in the past. Since it is cheaper to power our cars, stoves, heaters, air conditions, washers, etc. we now have more resources to dedicate to things that were not as high on the priority list when we were poor – such as higher education and advanced medical care. If you were to divide this chart up by income group, you would find that the largest fraction of income spend on energy comes from … the poor. Let’s keep that in mind when we promote policies intended to raise the cost of energy.

[…] WINTERCOW in 2010: Sorry to be reposting. But again I think the message is worth repeating, especially on this wonderful day. I don’t want you to feel down about it at all. If you would like to see the data from the remaining eleven days, start here. […]
[…] to feel down about it at all. If you would like to see the data from the remaining eleven days, start here. And yes an update is in order. But there are bigger fish to fry […]